Infospeed-banner-slice2

DemonstrationDemonstration GuideOverviewModule Purchase PlansFurther Reading
Class Sense Example Booking & Production Dashboards
Please use the following login details: username: demo password: demopassword


To view this Demonstration Guide in a separate window/tab in your browser, click here.
Filtering your Dashboards and Data
Each of your dashboards contains a series of “Widgets” which show data taken from an overnight download of the relevant (required) data from your Class Database. This data is sent into a cloud server where it is attached to our business intelligence engine for you to view in many different ways.

Default Filters
Your Filters are set to a default configuration. This default can be changed using the triple bar icon and selecting ‘Set as my default filters’.
default filter
Using the Filters
The filters on the right hand side allow you to adjust the information shown across the dashboard in one press. Please note that each widget will show a progress icon until the dashboard has refreshed according to the new filter selection. Depending on your internet connection speed this make take a few moments.
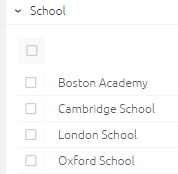
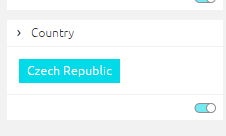
  • In the example figure 1 below, select the top box (shown above ‘Boston Academy’ filter) to toggle “All On” or “All off”
  • You can also select and deselect individual or multiple filters as required by clicking in the check boxes next to the data you wish to see. (figure 1)
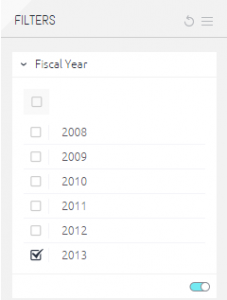
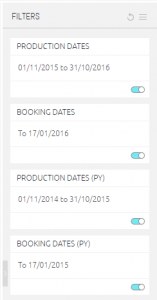
  • You can also switch the entire filter on and off using the slider on/off switch at the bottom of the filter section. (figure 2)
  • using the filter using the filter 2
    figure 1 figure 2
Unfiltered Widgets
Some of your widgets will be unfiltered because the data would not make sense using different filters. This will be identified on the header of the widget in the heading and “i” button as follows.
Additional Filtering on the Dashboard
When you drill into e.g. a pie chart and select an individual country or agent, this will change the filtered widgets to all now reflect this selection only. In the example below an additional filter will be placed at the bottom of filters panel to reflect that a user has clicked on the ‘Czech Republic’ slice in the pie chart.
additional filtering
  • In order to remove this filter you can either switch off the filter switch, re-click on the widget/pie chart or select the “Clear Selection” button.
  • To clear multiple filters you can select the “X” button on the widget header to take the widget back to its top level filter.
additional filtering 2
Drilling into Pie Charts
Pie charts can be drilled into to obtain more detailed analysis of a specific country or agent for example. This can be done by “Right Clicking” on a slice of the chart and then selecting the appropriate Heading e.g. Country or Agent.
Specific Territory, Country or Agent Dashboard Breakdown
When using Pie Charts you are also able to select a specific territory, country or agent by “Left Clicking” on it. When doing this you will notice the widgets across all of the filtered dashboards refresh to now show the data for this specific selection. E.g. select “AA Japan” agency and the entire dashboard will now refresh to show you their performance according to the filters.

Production Dashboard Date Filters
On the production based dashboard you will find four date range filters. These have been designed to allow you to show production statistics (when are students in your school) based on a particular booking period. So you could choose to see e.g.
  • How many students are expected in your school this year that are currently booked compared to the same booking point last year.
    (To do this change the Bookings Dates (PY) date to the todays equivalent date last year)
  • How many students are booked for this compared to the total bookings for last year.
    (To do this change the “Bookings Dates (PY)” date to include all bookings from earliest date to today’s date date)
4xproduction filters
Additional Widgets Features
Widgets can be expanded to full screen using the double arrow icon as shown below.
changing your widgets

Exporting from Class Sense.
It is possible to export and download your dashboard using the download button at the top right of the dashboard.
exporting the dashboard button

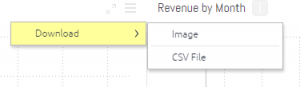
You will be given the option to download the data as follows:
exporting the dashboard

Exporting an Individual Widget
It is possible to download individual widgets by clicking on the following icon on each widget.
refreshing and restoring 2

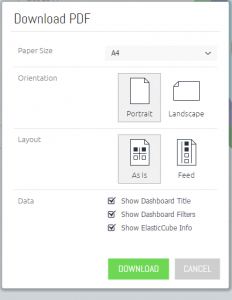
And then selecting the type of download required from the dropdown list as shown below.
download image
Refreshing and Restoring
You can refresh the widgets to restore your default filter settings using the refresh button.
refreshing and restoring
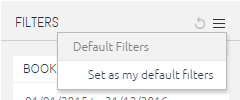
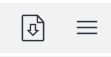
If you accidently change the configuration of any other part of your dashboard and want to restore it back to the original configuration then you can restore your dashboard here:
exporting the dashboard button
For further information or should you have any problems please contact [email protected]

What is Business Intelligence Reporting?
Typically Business Intelligence Reporting consists of Dashboards, Widgets, Charts and tables of your data on a web-based platform which you interact with to quickly view your data in many different ways. BI tools also give you the ability to drill into reports and look at the overview and detail from the same dashboard.
Class Sense Dashboard
What is the Class Sense Module?

We have now partnered with a very powerful BI engine tool from a company called Sisense (http://www.sisense.com/press-room/). Their BI engine met our needs very well and has enabled us to find a cost effective BI solution.
Class Sense Dashboard

This is a very powerful tool capable of crunching millions of rows of Class data showing you different views of your data at the touch of a button. You can even bring in your own spreadsheets, accounting information, Google Analytics data and present it on the same system.

Using Sisense we are providing a new Business Intelligence (BI) Reporting Module for Class.

Why Should I Pay an Additional Cost for Reports in Class?

Class.NET will continue to offer statistical reporting and Class Web in the future will have much improved general reporting functionality. However, Class Sense should not be compared to the statistical reporting currently available in Class. This module is an extremely sophisticated and powerful reporting tool that many large organisations use to allow managers to view data in many different ways at the touch of a button, without the need to run reports. This software generally costs many thousands of pounds to obtain. (Typically 20k). It took our teams a year to engineer a model that worked for Class, such is the complexity of the Class data structure.

What will the standard Class Sense module offer?

As standard you will be supplied with two Online Data Dashboards:

  • Bookings Based – Reports on when you bookings were obtained
  • Production Based – Reporting on when your students were/are in attendance

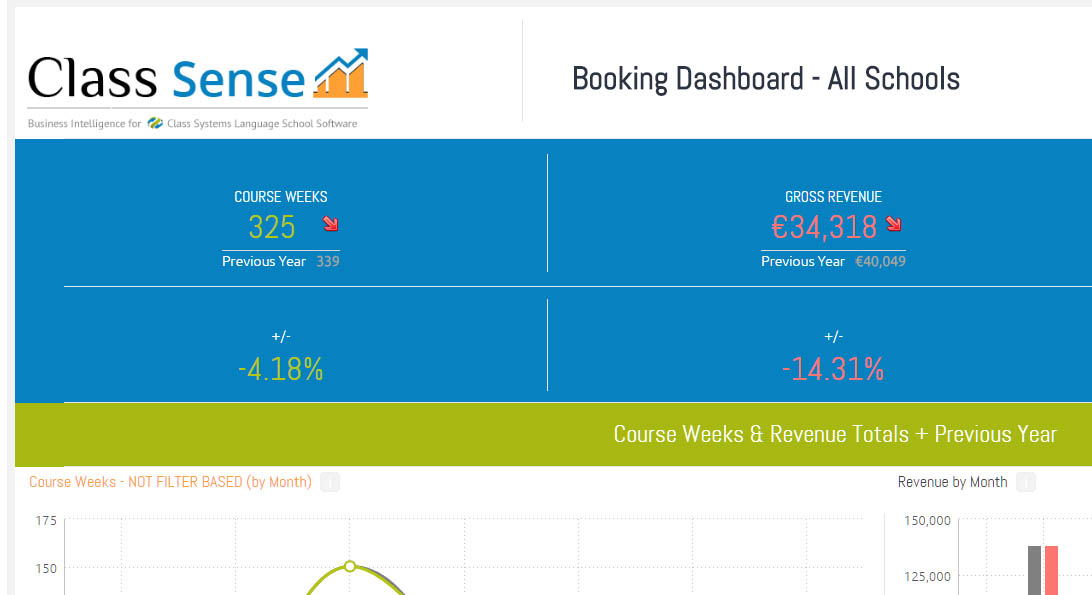
Each of these will show annual comparisons for Net Revenue, Weeks and comparison data for the previous year.

These reports will as standard include filters for dates, schools, Agent/Direct, Price Item Category (e.g. show Tuition income only). The reports will offer Drill Down breakdowns (e.g. Territory to Country to Agent). Reports can also be exported to PDF or CSV.

As a simple example you might see e.g. Student weeks by territory, drill in and see by nationality, use filters to compare schools, then compare this with last year then view this by Agent breakdown etc. All presented on a minimum of two dashboards (Booking and Production) and including charting, interactive graphs, maps and interfaces etc.

Is it web-based?
Yes the solution is web based and for those customers that have Class Sense this will be built into our next generation Class Web platform.
How does it work?
Infospeed has a secure web-based server on the Cloud on which the SiSense “Elasticube” (read ‘engine’) sits. This is effectively a series of sophisticated links interconnecting your data to allow drill down reporting.
  • Our engineers will arrange for the required data from your Class database to be uploaded from your server onto our Cloud server overnight. We will then automatically “rebuild” the Elasticube to allow you to report the next morning on overnight data. Note that the system does not work off the “live” database on your server.
  • You then log into Class Sense using your Class Sense license and view the dashboards and within them the widgets that show your reported data.
  • These dashboards can then be sent as a snapshot to your team (e.g. as a PDF file) and the data from each widget can be exported to CSV files at the touch of a button.
What can I do with my Dashboards and Widgets?
You will initially be given a set of standard dashboards with both booking and production-based standard statistics. With your Class Sense Licences you will be able to drill in and out of data sets and change your filters to see your statistics in many different ways.
Can I create my own Dashboards?
Amendments to the dashboard configuration and reporting you see (as well as additional widgets and dashboards) can be designed and created by Infospeed.
Can I have my own Elasticube?
We understand that many customers will want to view and digest data in many different ways.
If you want to report using different “logic” to our standard Elasticube then simply contact us and tell us how you want to view the data. We can then create a custom Elasticube for your data to which unlimited custom dashboards can be created to meet your individual user requirements if you so wish. This would be a bespoke project and could pull external data in from a wide range of other sources such as Excel spreadsheets and even Google Documents/Analytics so e.g. you can place your budget figures, own exchange rates and web marketing stats into the mix for reporting purposes.
What Happens Next?

If you would be interested in taking this further we would be happy to quote you for the module.

We hope you agree this is an excellent enhancement to Class and look forward to discussing this Module with you. Please contact Gary or Yasmin at [email protected] for more information.

class sense logo3 class sense logo3
How will the Module be charged?
The big benefit in addition to the powerful reporting is that you don’t have to pay the large annual license costs associated with a fully functional Business Intelligence solution. These systems are normally only viable for large companies. We give you access to the module through our agreement, sharing the costs between our users.
There are two stages to receiving our Class Sense Module:
Purchase or Annually License the Module
The module itself will need to be purchased initially in the same way as you buy any Class Module. This pays for the set-up and development of your standard dashboards and Elasticube as well as the changes required to your Class system to provide the data to our server and establishing your daily upload routines.
Ongoing Subscription (ASMU)
Access to the module itself will then be offered on a subscription basis and is aimed at “Management” or “Sales Management” users of Class to offer this higher much more flexible level of reporting. Equally of course you may want to develop academic dashboards or accommodation ones and give those staff access to your Class Sense dashboards. This cost will be added to your Annual Support Maintenance and Upgrade Contract – ASMU.
Who can Access the Module?
Access would be limited to only those Class Sense subscribed users i.e. there will be a separate number of Class Sense users than Class users.
What types of Users are Available?
There will be 1 type of User access to the Class Sense module – Consumer Access. This includes drill down and filtering of data as standard but does not allow any changes of the design of the dashboards which must be done by Infospeed.
What will the purchase of the module cost?
Please contact [email protected] for details and a quote.
What will the Ongoing Subscription cost – Consumer Licence?
Please contact [email protected] for details and a quote.
What happens if I Stop Subscribing?
A subscription for users can be cancelled with 30 days’ notice. The remaining ASMU will be refunded. This user will lose access to your Elasticube and dashboards. If you remove all users, a back-up of these will be retained by Infospeed on request however and you can re-subscribe at any time. An administration fee will be chargeable to re-establish the Elasticube and Dashboards on our Webserver. Additional updating will be at extra charge.
Can We Feedback into the Standard Dashboards/Elasticube?
If you are interested in inputting your thoughts into the design of the standard or your own dashboards feel free to contact Gary or Yasmin on [email protected]. We would be very interested to see what you come up with. So for example “We would like to see Student weeks by nationality broken down by course group and drill into course”.
What Happens Next?

If you would be interested in taking this further we would be happy to quote you for the module.

We hope you agree this is an excellent enhancement to Class and look forward to discussing this Module with you. Please contact Gary or Yasmin at [email protected] for more information.

class sense logo3 class sense logo3
Further Reading
You may also want to look at the following links to see the power of the system.